
Specifications
| Size | Fine Metal Content | Diameter | Weight | Fineness |
| 1 oz | 33.933 g (1.0910 troy oz.) | 32.7 mm | 33.933 g (1.0910 troy oz.) | .916 or 22 kt |
| 1/2 oz | 15.551 g (.5 troy oz.) | 27mm | 16.966 g (.5455 troy oz.) | .916 or 22 kt |
| 1/4 oz | 7.776 g (.25 troy oz.) | 22mm | 8.482 g ( .272 troy oz.) | .916 or 22 kt |
| 1/10 oz | 3.110 g (.10 troy oz.) | 16.5mm | 3.393 g (.1091 troy oz.) | .916 or 22 kt |
Description
The Gold American Eagle 2025 mintage is available for order now. This bullion coin is one of the U.S. Mint’s most popular. The 2025 Silver American Eagle is also available.
DEALERS- Order NOW!: Call the trading room to order 800.375.4653 or login to FizTrade.com
The American Eagle Gold Bullion Coins were first minted in 1986 after being authorized by the Bullion Coin Act of 1985 and is produced from gold that is newly mined from sources in America.
American Eagles use the durable 22 karat standard established for gold circulating coinage over 350 years ago. Each coin contains its full, stated weight of pure gold with the balance consisting of silver and copper, added to increase the coin’s durability.
American Eagles’ chief unique property is that they are the only gold bullion whose weight, content and purity are guaranteed by the United States Government. American Eagles are also valid for precious metals Individual Retirement Accounts (IRAs).
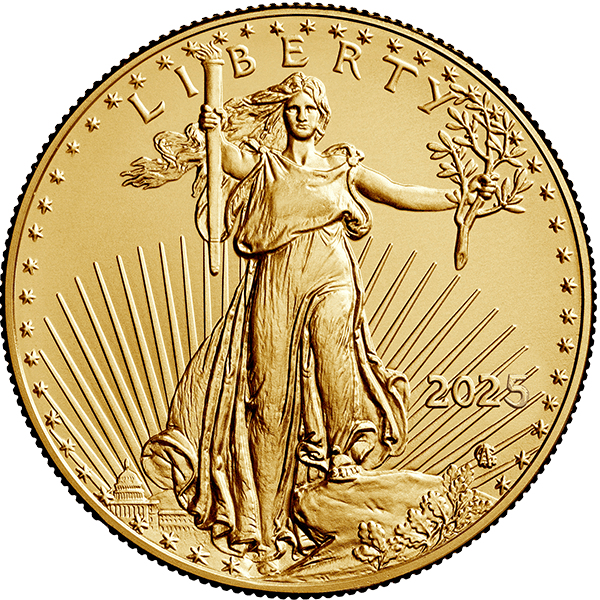
The obverse (front) design is inspired by artist Augustus Saint-Gaudens’ celebrated $20 gold piece that was minted from 1907-1933. It is considered by many to be one of America’s most beautiful coins.
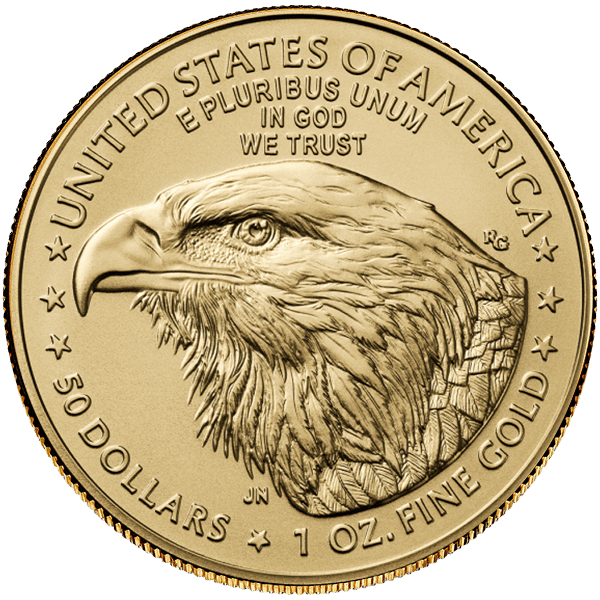
The new reverse design features a profile of an American eagle. Jennie Norris from the Artistic Infusion Program (AIP) artist designed the eagle and Mint medallic artist Renata Gordon sculpted it. The reverse image was changed in the middle of 2021.
The original reverse was designed by sculptor Miley Busiek and depicts a male eagle carrying an olive branch as he flies over the nest of his mate and her hatchlings. According to Busiek, the design was inspired by Ronald Reagan’s acceptance speech at the Republican National Convention in 1980. The theme of his speech was ‘Together, a new beginning.’ In an interview in “Coin News Today”, Busiek said, “I didn’t think that anyone had ever depicted our national symbol, the American bald eagle, except as a single heraldic eagle. I liked the idea of thinking of America as a caring family, so I put together a sketch showing not just one eagle, but a whole family.”